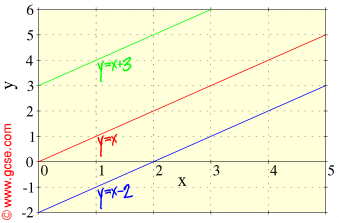
Another way of drawing different x-y graphs is to make the line higher or lower than y=x:
The green line y=x+3 above is higher up than the line y=x because each value of y on the line is 3 more than that of x. However, the blue line y=x-2 above is lower down than the line y=x because each value of y on the line is 2 less that of x. The number after x in the formula tells us how high the line will be. Positive values raise the line, negative values lower it. N.B. Notice that all three lines above have the same gradient.
|


